
The Impacts Of
‘Investing in Creativity’
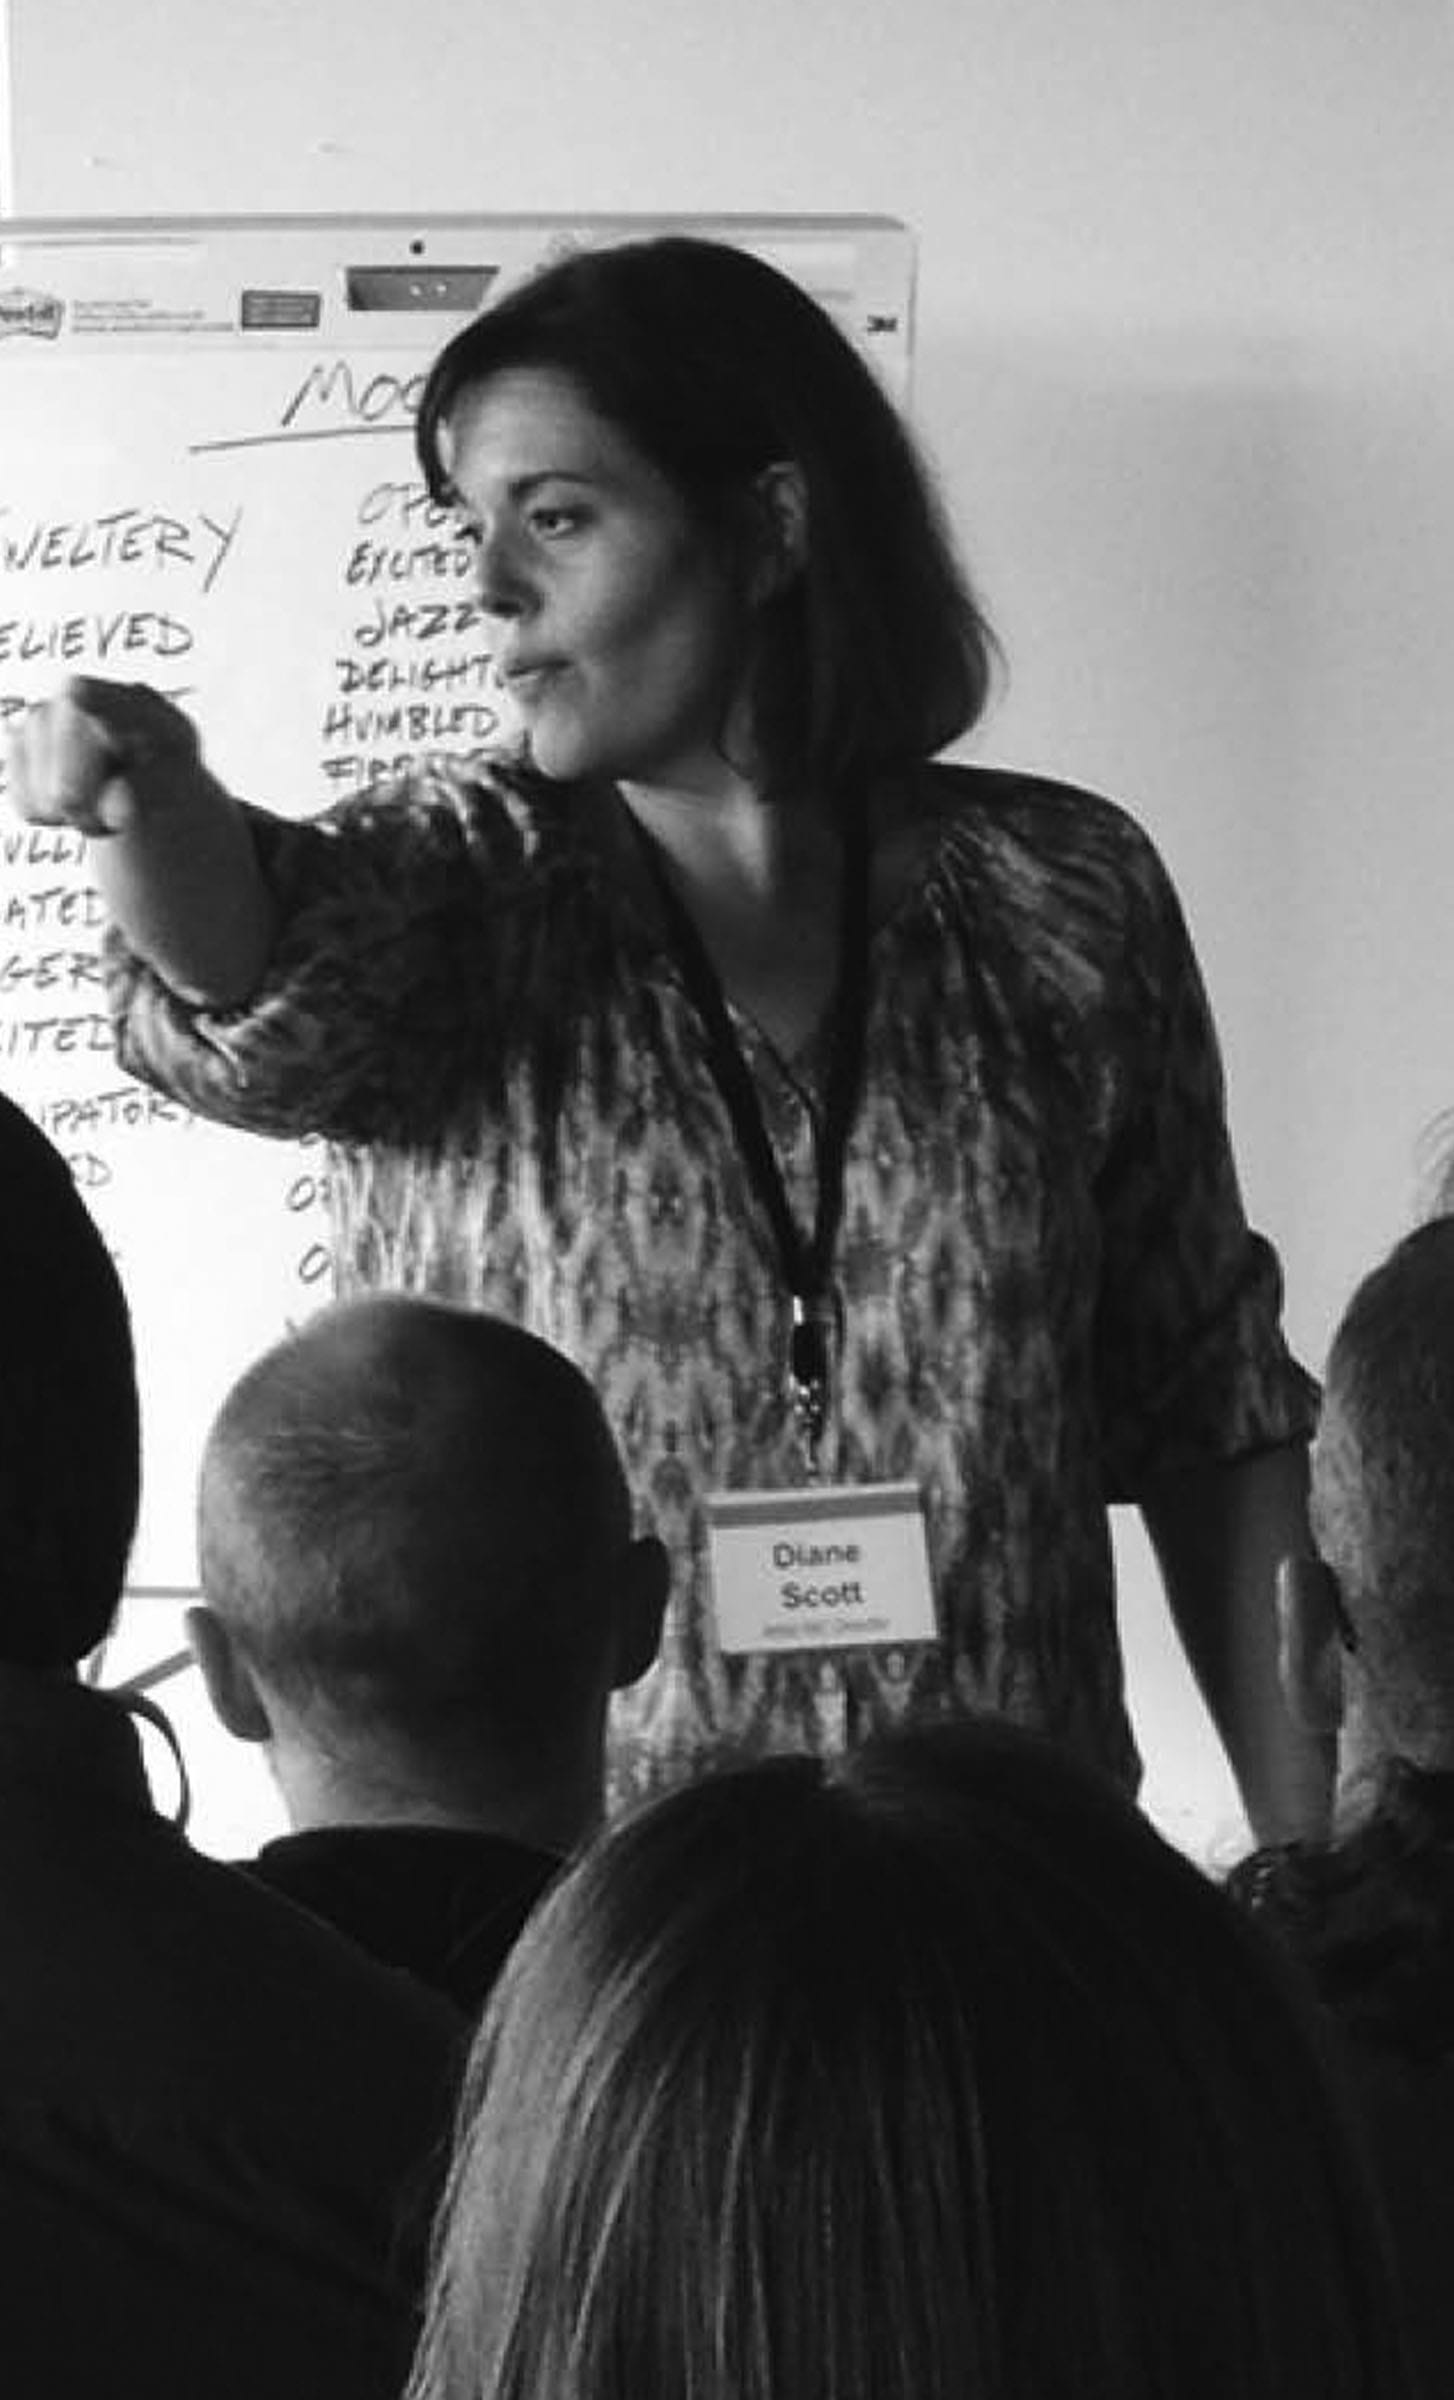
Text by Diane Scott, Artist INC Founder
In 2008, when the Artist INC program was designed, a primary focus in artist support was providing training and development through knowledge delivery. Using the education archetype of the time, the assumption was that there was simply an information gap in artists’ knowledge of the business functions needed to facilitate sustainable artistic practices. Bring in subject matter experts, teach artists the basics of business, close that gap, and the problem would be fixed. Influenced by a few nascent traditional entrepreneurship professional development programs that were beginning to explore the importance of peer networks as well as research into best practices in adult education, the Artist INC program was designed with a new three-legged model in mind: combine knowledge delivery with both mentorship and peer networks.
Combine knowledge delivery with both mentorship and peer networks
Even though we now know the three-legged model to be integral to its success, we didn’t fully appreciate why it worked or its power at the time. While the program utilized one-on-one mentoring and “roundtable-like” small groups, it still devoted half of its face-time to lecture style information sessions led by non-artist subject matter experts. Bring in experts to fix the knowledge gap and the artists would have what they need to succeed. What we quickly found anecdotally, however, is that the knowledge gap is different for everyone and is a perpetually moving target. Each individual’s knowledge gap is deeply contingent upon where they are currently and where they want to be. Both sides of that equation have infinite combinations of variables, well beyond differences in discipline and media. Where an individual artist currently is and where they want to be is also in a perpetual state of flux. The information needed for any combination of variables changes as rapidly as our environment does. Instagram didn’t exist in 2009 and the tax code for arts businesses has been completely transformed in the last two years. What artists needed wasn’t for us to fill the gap, but to help them develop the philosophy and the resources to perpetually fill an everchanging gap.

And, while research and expertise are important cornerstones of the programming, we now know that any time you have a room full of artists, you likely have the answer (or at least the path to an answer) to any question another artist might ask. We had to learn to trust ourselves, and to trust artists. In turn, the most important gap Artist INC fills for artists is learning the power of trusting artists (including themselves).
These lessons weren’t just learned anecdotally. The data told us the story and continues to do so. The systematic collection of data from Artist INC participants before the seminar, after the seminar, and in one-, two-, and five-year longitudinal iterations has shown the program to have a statistically significant positive impact on the arts businesses of participating artists. The data has informed the continuous model of the program improvement used. It has shown us continued increases in many measures that continue to grow well beyond the initial impact of the program. We’ve dubbed these “durable” measures and they demonstrate that the benefits stretch far into the future beyond the initial investments in individual creativity.
What artists needed wasn’t for Artist INC to fill an information gap, but to help them develop the philosophy and the resources to perpetually fill an ever changing gap.
Artist INC Timeline
Program History
The roots of the Artist INC seminar can ultimately be traced back to the Culture Wars of the 1990s and the resulting federal funding reductions for American artists.
The crisis for artists that followed inspired the Ford Foundation to commission the Urban Institute to study the environment of support mechanisms for artists. Culminating three years of research, the Urban Institute published its report, Investing In Creativity, in 2003. This report outlined a comprehensive framework for improving the conditions of American artists centered on six domains: Building on this research, the Ford Foundation, with subsequent funding from numerous other national arts and culture funders, launched a ten-year initiative in 2003. This initiative, Leveraging Investments in Creativity (LINC), was a philanthropic experiment to use money, information, strategy, and partnerships to build upon the framework outlined in “Investing in Creativity” and create change in the American support system for artists.

Investing
in Creativity
10 Year Initiative
2003
2003 Urban Institute publishes Investing in Creativity
2003 Ford Foundation Launches Ten Year Initiative Leveraging Investments in Creativity (LINC)
In 2008, a partnership of the Charlotte Street Foundation, the Arts Council of Metropolitan Kansas City, and the University of Missouri-Kansas City Innovation Center received a LINC Creative Communities grant to establish Artist INC. Artist INC programming was intentionally designed to address four of the Investing in Creativity domains for artists residing in the Kansas City metropolitan area.
1 Validation
2 Training and Professional Development
3 Communities and Networks
4 Information

2008 Artist INC Established Charlotte Street Foundation, Arts Council of Metropolitan Kansas City, University of Missouri Kansas City Innovation Center receive a grant to establish Artist INC.
The heart of Artist INC programming, its eight-week seminar, was launched in 2009 and has been completed by 347 Kansas City artists in its first decade.
2009
Artist INC Seminar
Launches in Kansas City

2011
Artist INC Seminar
Launches in Wichita
2012
Artist INC launches
Artist INC Advance
2013 $18 Million Invested In its ten years, 2003 to 2013, LINC invested over $18 million in more than 100 partner organizations in communities across the country (LINC, n.d.). One of those communities was Kansas City.
2013
Mid-America Arts Alliance
Joins Partnership
to expand Artist INC programming.
2013
Artist INC Seminar
Launches in Argenta
and Oklahoma City
2014
Artist INC Seminar
Launches in Austin
and Omaha
Artist INC
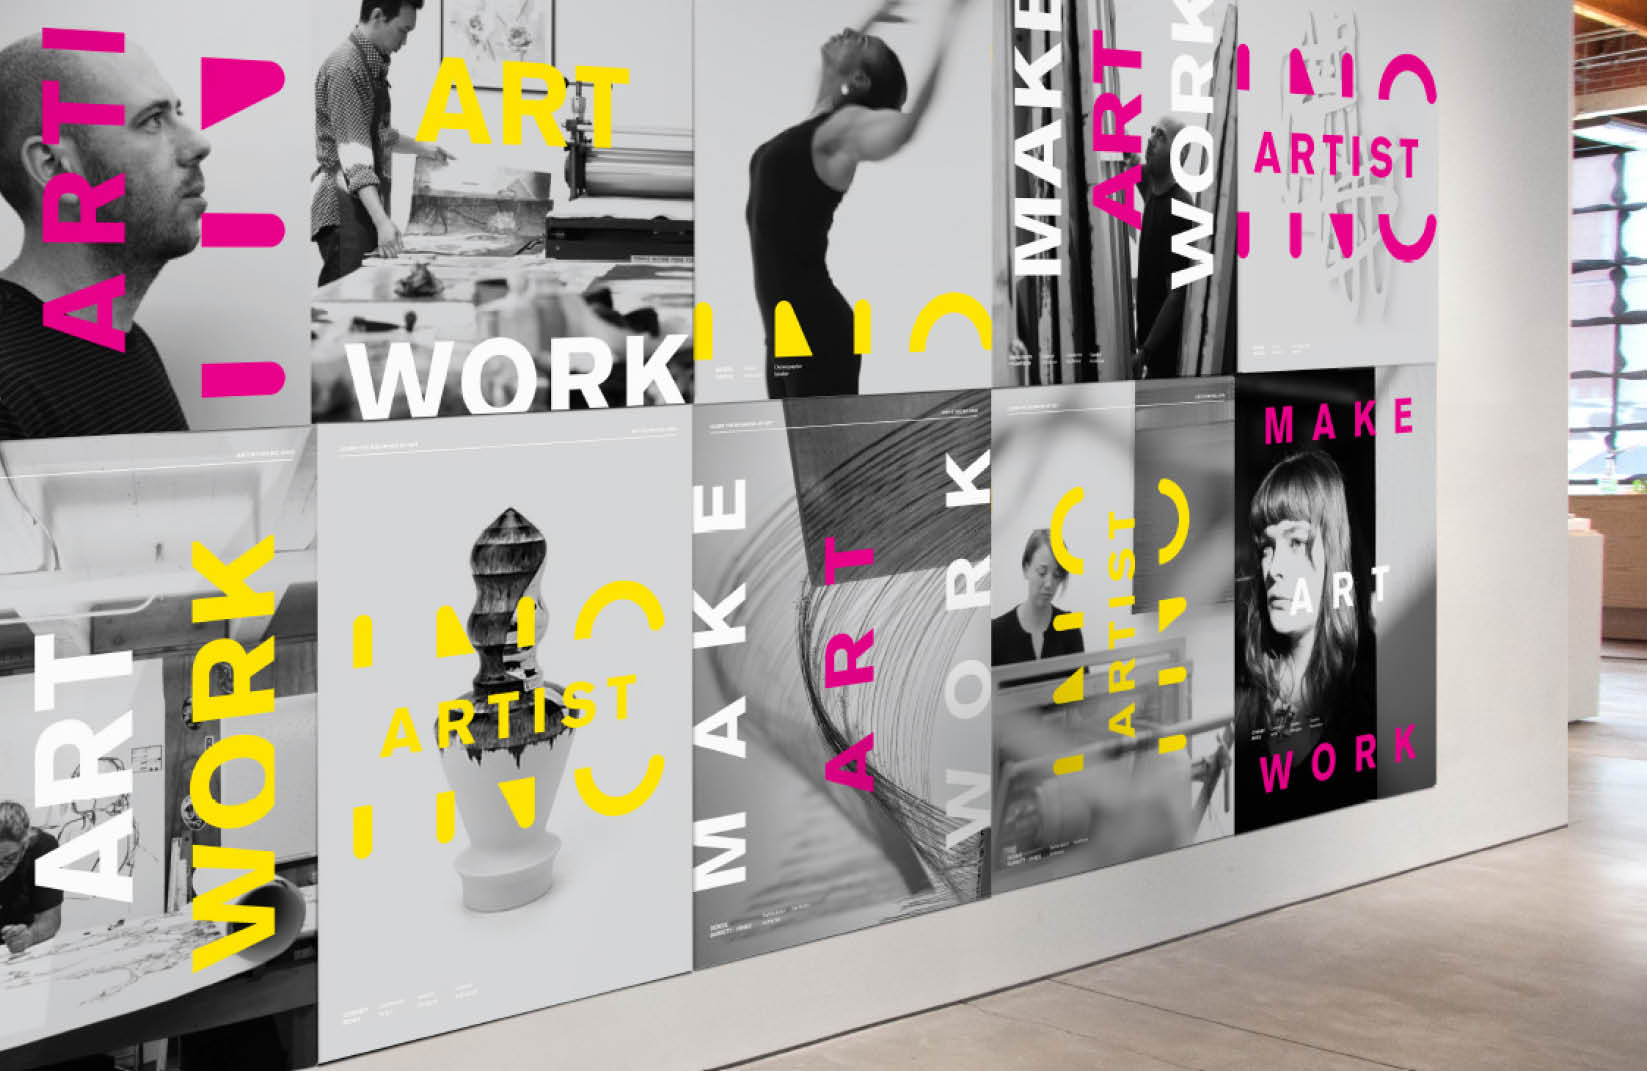
Rebrand
2016 Artist INC Invests in Rebrand transforming the professionalism of their brand image and refines their outward communications.
2016
Artist INC Seminar
Launches in Lawrence
and Tulsa
1,054
Total Artists
2017
Artist INC Seminar
Launches in Northwest Arkansas
and Houston
2017
Mid-America Arts Alliance
fully aquires Artist INC.
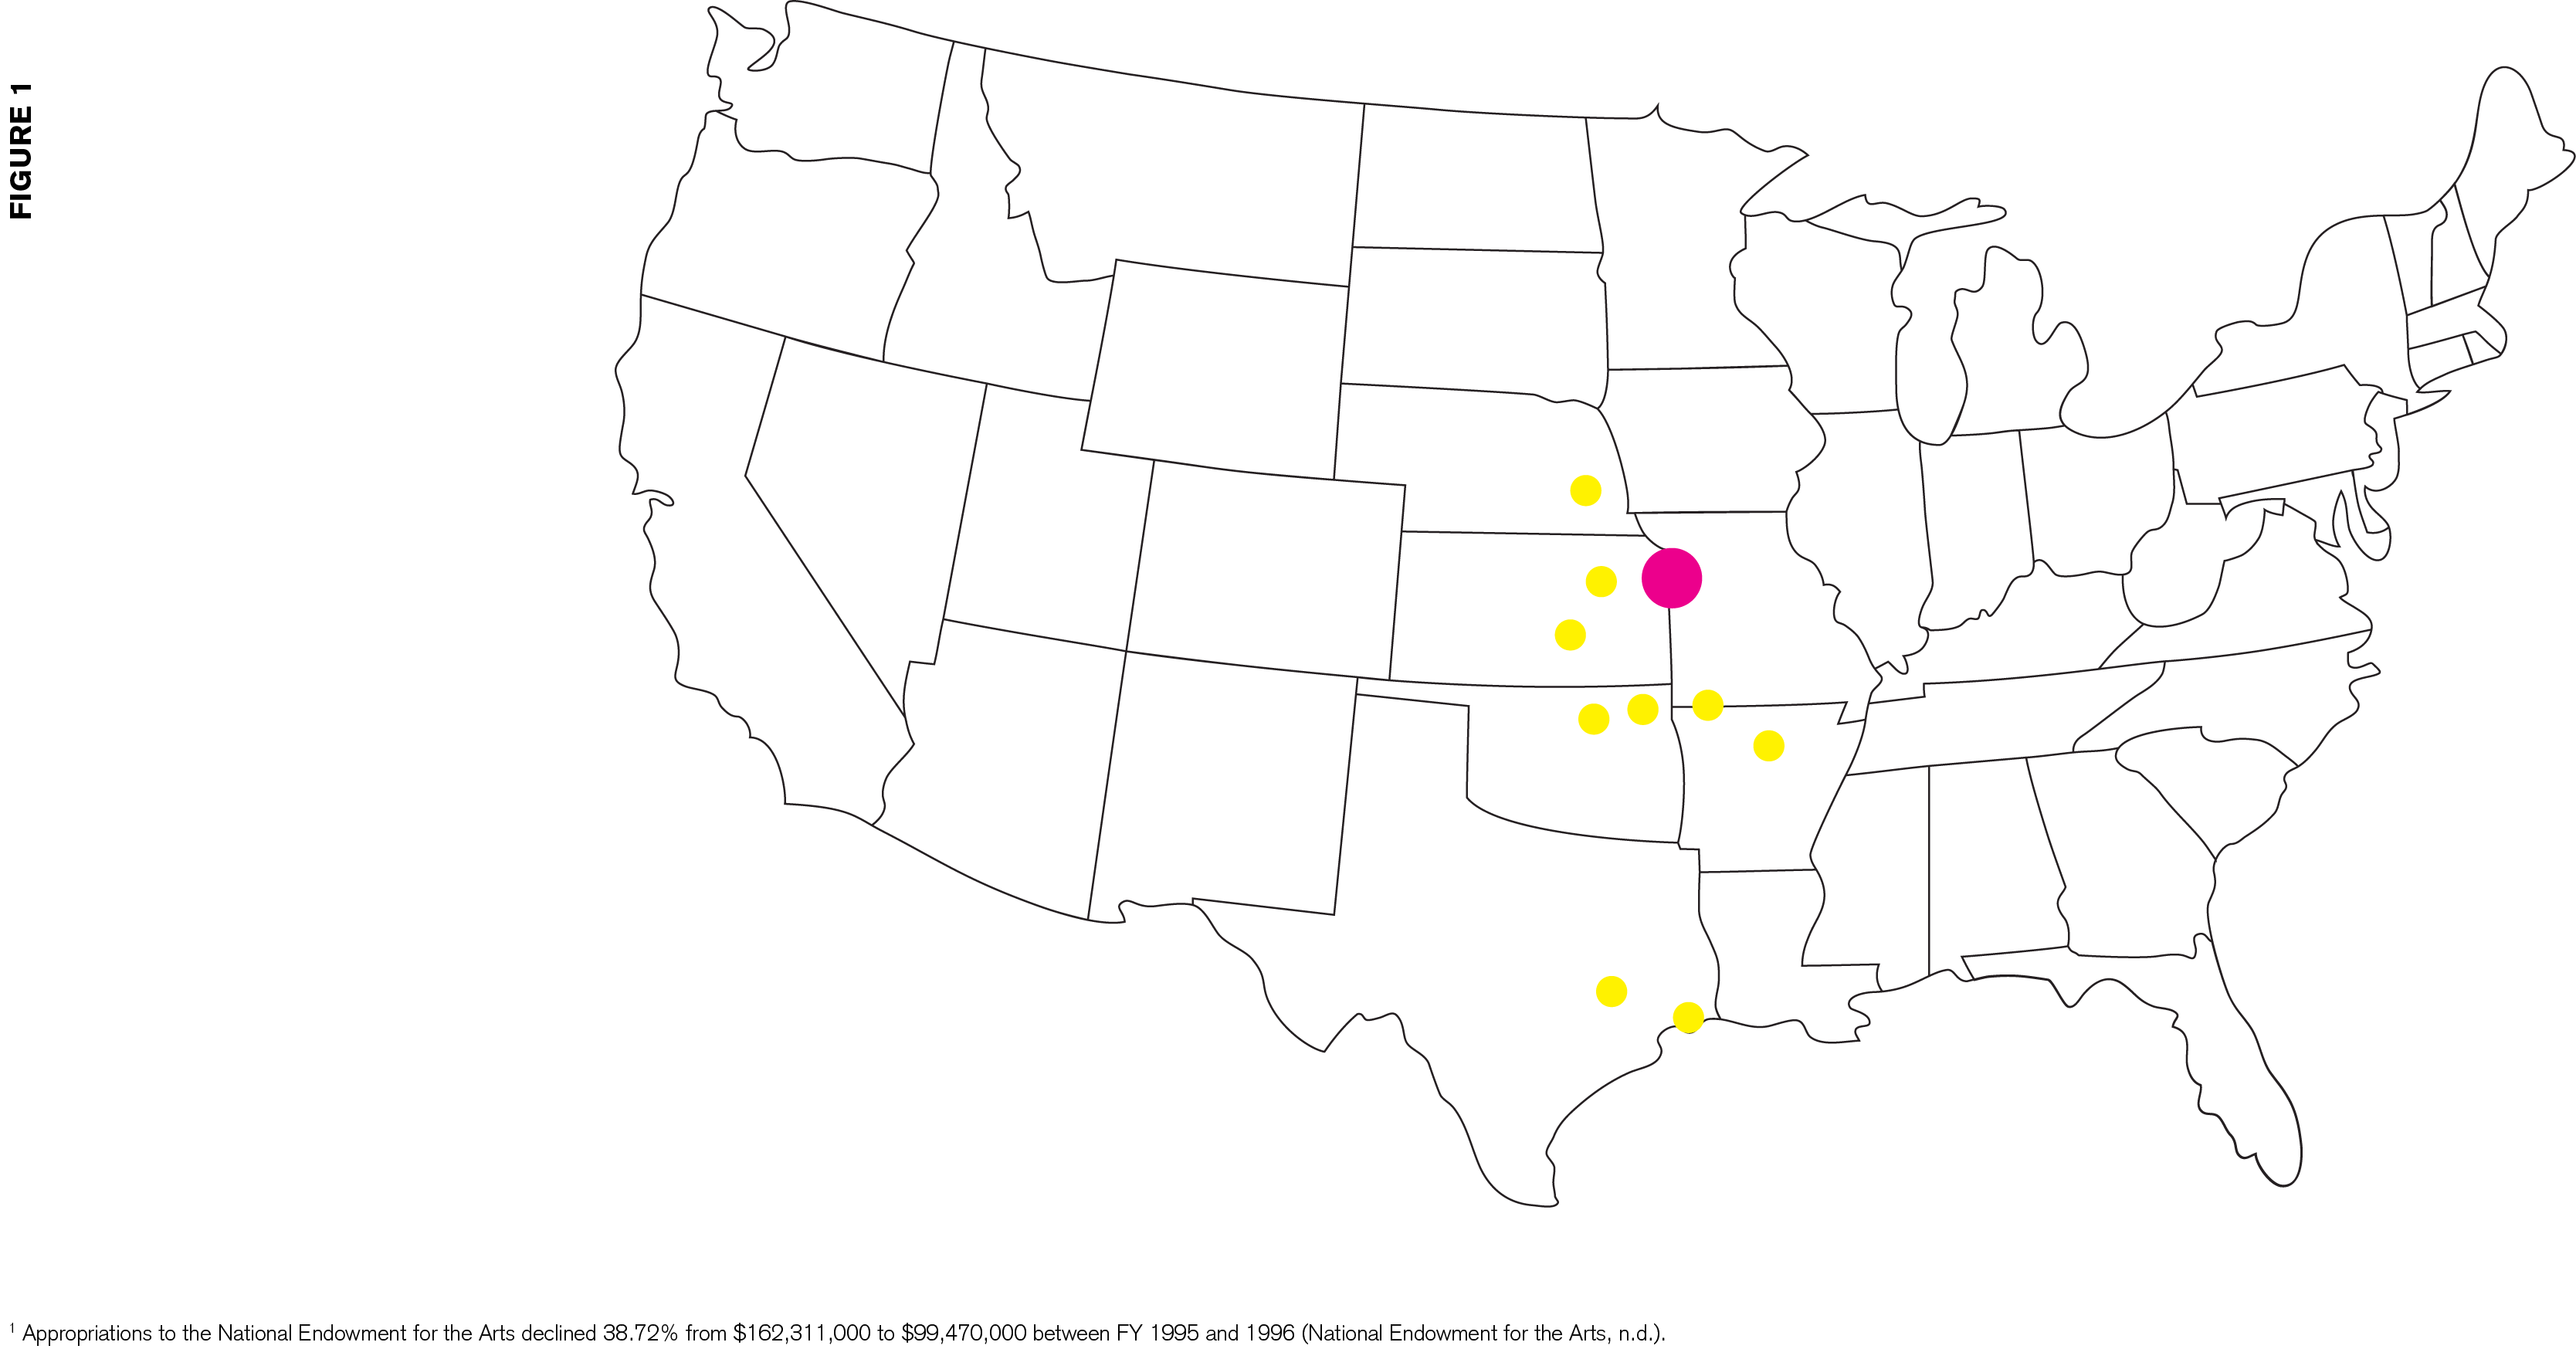
As of 2017 1,054 Artists have completed the seminar in ten communities across the M-AAA six state region.
The outcome
attainment of Artist INC
participants quickly led to demand for programming outside the Kansas City area, and in 2013 Mid-America Arts Alliance joined the partnership to expand Artist INC programming, fully acquiring the program in 2017. By the end of the first decade of programming in 2019, the Artist INC seminar had been completed by a total of 1,054 artists in ten communities across the M-AAA six-state region (Figure 1).
347 Kansas
City Artists

2019
Over 347 Kansas City Artists
have completed Artist INC seminar
in its first decade.
2019 Artist INC convenes Peer Facilitators from across the region for Peerpalooza!
1,054 artists in 10 communities across six states have completed the Artist INC program.

2021
Artist INC Seminar to
Launch in Des Moines
and Topeka
The Data
From its inception, the Artist INC seminar was research based and data driven.

Outcomes were identified through a six-month long feasibility study process prior to program development, and then systematically surveyed with carefully constructed questionnaires administered to participants at pre-seminar, post-seminar, twelve months post-seminar, twenty-four months post-seminar, and sixty months post-seminar. The resulting data has been used and continues to be used to make assessments of the efficacy of individual seminar offerings, to guide program revisions, and to influence new programming.
The survey instruments acquire information on artist tools and skills, financial and legal practices, and attitudes. The pre-seminar instrument has been administered to and completed by all 1,054 adult participants in the Artist INC seminar over the past decade. Because of the strong connections the program engenders, there is a very high completion rate at the post-seminar , twelve-month , twenty-four-month , and sixty-month longitudinal levels. All of the collected data has been coded by individual and is pairable over longitudinal iterations. The resulting database includes one of the most detailed longitudinal data sets of practicing artist conditions in a specific community post-professional development intervention in the United States.
The Artist INC seminar outcomes focus on the Investing In Creativity domains as follows:
Significant data findings
As the inaugural and longest running community, Kansas City presents the most data on longitudinal outcomes currently available. The following analysis of program outcome attainment utilizes that community’s data set and highlights the most significant findings.
Functional
Knowledge Gains
As previously noted, one pillar of the three-legged model is knowledge gains in the functional areas of arts business. A comparison of knowledge levels before and after the seminar demonstrates significant gains at the actionable levels of “understand and identify steps” or “understand and apply” in all assessed areas (Figures 2-4):
- No knowledge of topic
- Have heard about the topic, but know little about what it means
- Can define the concepts in the topic
- Can understand the basic terminology and concepts, can identify the steps to take to apply them
- Can understand and apply the concepts in my art business
- Planning
-
- Marketing
-
- Finance
-
Functional
Knowledge Gains
- No knowledge of topic
- Have heard about the topic, but know little about what it means
- Can define the concepts in the topic
- Can understand the basic terminology and concepts, can identify the steps to take to apply them
- Can understand and apply the concepts in my art business
- Writing
-
- Legal
-
Functional
Knowledge Gains
- No knowledge of topic
- Have heard about the topic, but know little about what it means
- Can define the concepts in the topic
- Can understand the basic terminology and concepts, can identify the steps to take to apply them
- Can understand and apply the concepts in my art business
- Grants
-
- Technology
-
Functional
Knowledge Gains
Impact in applying
business concepts
Following Artist INC 93% of artists are able to understand
arts business concepts and how to apply them.
Strategic
Planning
The cornerstone of the Artist INC seminar is strategic planning. Artists work in mentored peer groups to develop and refine their long-term, midrange and short-term goals throughout the seminar. Artists dramatically increase the rate at which they have written goals with 46.4% more participants having written goals twelve months post -seminar. These gains are durable with 43.2% more participants having written goals sixty months post-seminar. (Figure 5).
related to your art business?
- No
- Yes
- Increase
- Intake
-
- 12 Months
-
- Increase
-
- Intake
-
- 24 Months
-
- Increase
-
- Intake
-
- 60 Months
-
- Increase
-
Strategic
Planning
strategic plans.
Increase in artists
defining goals
One year after Artist INC 85.3% of artists have written goals related to their art business, an increase of 46% from pre-seminar.
Resource
Access and Use
and, unsurprisingly, they are much more likely to have received a grant, if they have applied for one (30.7% increase between intake and sixty months post-seminar) (Figure 7).
any art grants?
- No
- Yes
- Increase
- Intake
-
- 12 Months
-
- Increase
-
- Intake
-
- 24 Months
-
- Increase
-
- Intake
-
- 60 Months
-
- Increase
-
Resource
Access and Use
Peer networks also influence artists’ access to and use of professional services in support of their art businesses. By sixty months post-seminar, 58.8% of participants have accessed an accountant in relationship to their art business, 30.9% more than prior to the seminar (Figure 8).
- No
- Yes
- Increase
- Intake
-
- 12 Months
-
- Increase
-
- Intake
-
- 24 Months
-
- Increase
-
- Intake
-
- 60 Months
-
- Increase
-
Resources
Access and Use
Application increase
to Artist INC
Prior to Artist INC four in 10 artists had applied for an arts grant. Five years post seminar this increases to more than seven in 10 artists who had applied. With more applications comes more grants. Twice as many artists have received an arts grant five-years post-seminar versus pre-seminar.
Increase in use of available resources
Artists increasingly access professional resources. Prior to Artist INC only a quarter of artists had used an accountant for their arts business. By five years post-seminar more than half of artists had used an accountant.
Peer
Networks
While only a secondary focus of the program at its launch in 2009, the importance of peer networks to artist sustainability and success has moved to the forefront of the Artist INC seminar over its decade of offerings. Durable improvements occur and continue to grow post-seminar. Artists’ self-assessments of their quantity of relationships with local artists inside their artistic discipline increase 19.8% between pre-seminar and twelve months post-seminar. They continue to increase over time with a 30.4% increase over intake at sixty months post-seminar.
- Intake
-
- 12 Months
-
- Increase
-
- Intake
-
- 24 Months
-
- Increase
-
- Intake
-
- 60 Months
-
- Increase
-
Peer
Networks
The same improvements hold true for quantities of relationships with artists outside their artistic discipline. Artists report a 28.7% increase in these relationships between intake and twelve months post-seminar. The gain increases to 35.8% at sixty months post seminar (Figure 10).
- Intake
-
- 12 Months
-
- Increase
-
- Intake
-
- 24 Months
-
- Increase
-
- Intake
-
- 60 Months
-
- Increase
-
Peer
Networks
Artists likely use these increasing relationships to solicit advice relative to their art business with a 24.8% increase in self-reported frequency of advice seeking between pre-seminar and sixty months post-seminar (Figure 11).
- Intake
-
- 12 Months
-
- Increase
-
- Intake
-
- 24 Months
-
- Increase
-
- Intake
-
- 60 Months
-
- Increase
-
Peer
Networks
long-term peer networks.
Relationship Increase
within artist disciplines
Artists increase their quantity of relationships with other local artists in their discipline by 20% one year post-seminar and by 93% five years post-seminar.
Relationship Increase
Outside of Discipline
Artists increase their quantity of relationships with other local artists outside their discipline by 29% one year post-seminar and by 36% five years post-seminar.
Increase In Use
of available Support
Artists also increasingly access those networks for support, seeking advice and information from other local artists 28% more frequently one year post-seminar.
Perceptual Change
Some of the most important changes facilitated by the program are perceptual. Intended to measure artists’ overall perceptions of their self-efficacy relative to the “business of their art,” participants are also asked “Do you consider yourself an ‘entrepreneur?’” Here the data demonstrates increases in participants’ perceptions of themselves as entrepreneurs that continue to grow over time. By twelve months post-seminar, there is a 15.6% increase in the number of participants that consider themselves entrepreneurs. This continues to grow over time with a 24.6% increase in this perception at sixty months post-seminar (Figure 12).
an “entrepreneur?”
- No
- Yes
- Increase
- Intake
-
- 12 Months
-
- Increase
-
- Intake
-
- 24 Months
-
- Increase
-
- Intake
-
- 60 Months
-
- Increase
-
Perceptual Change
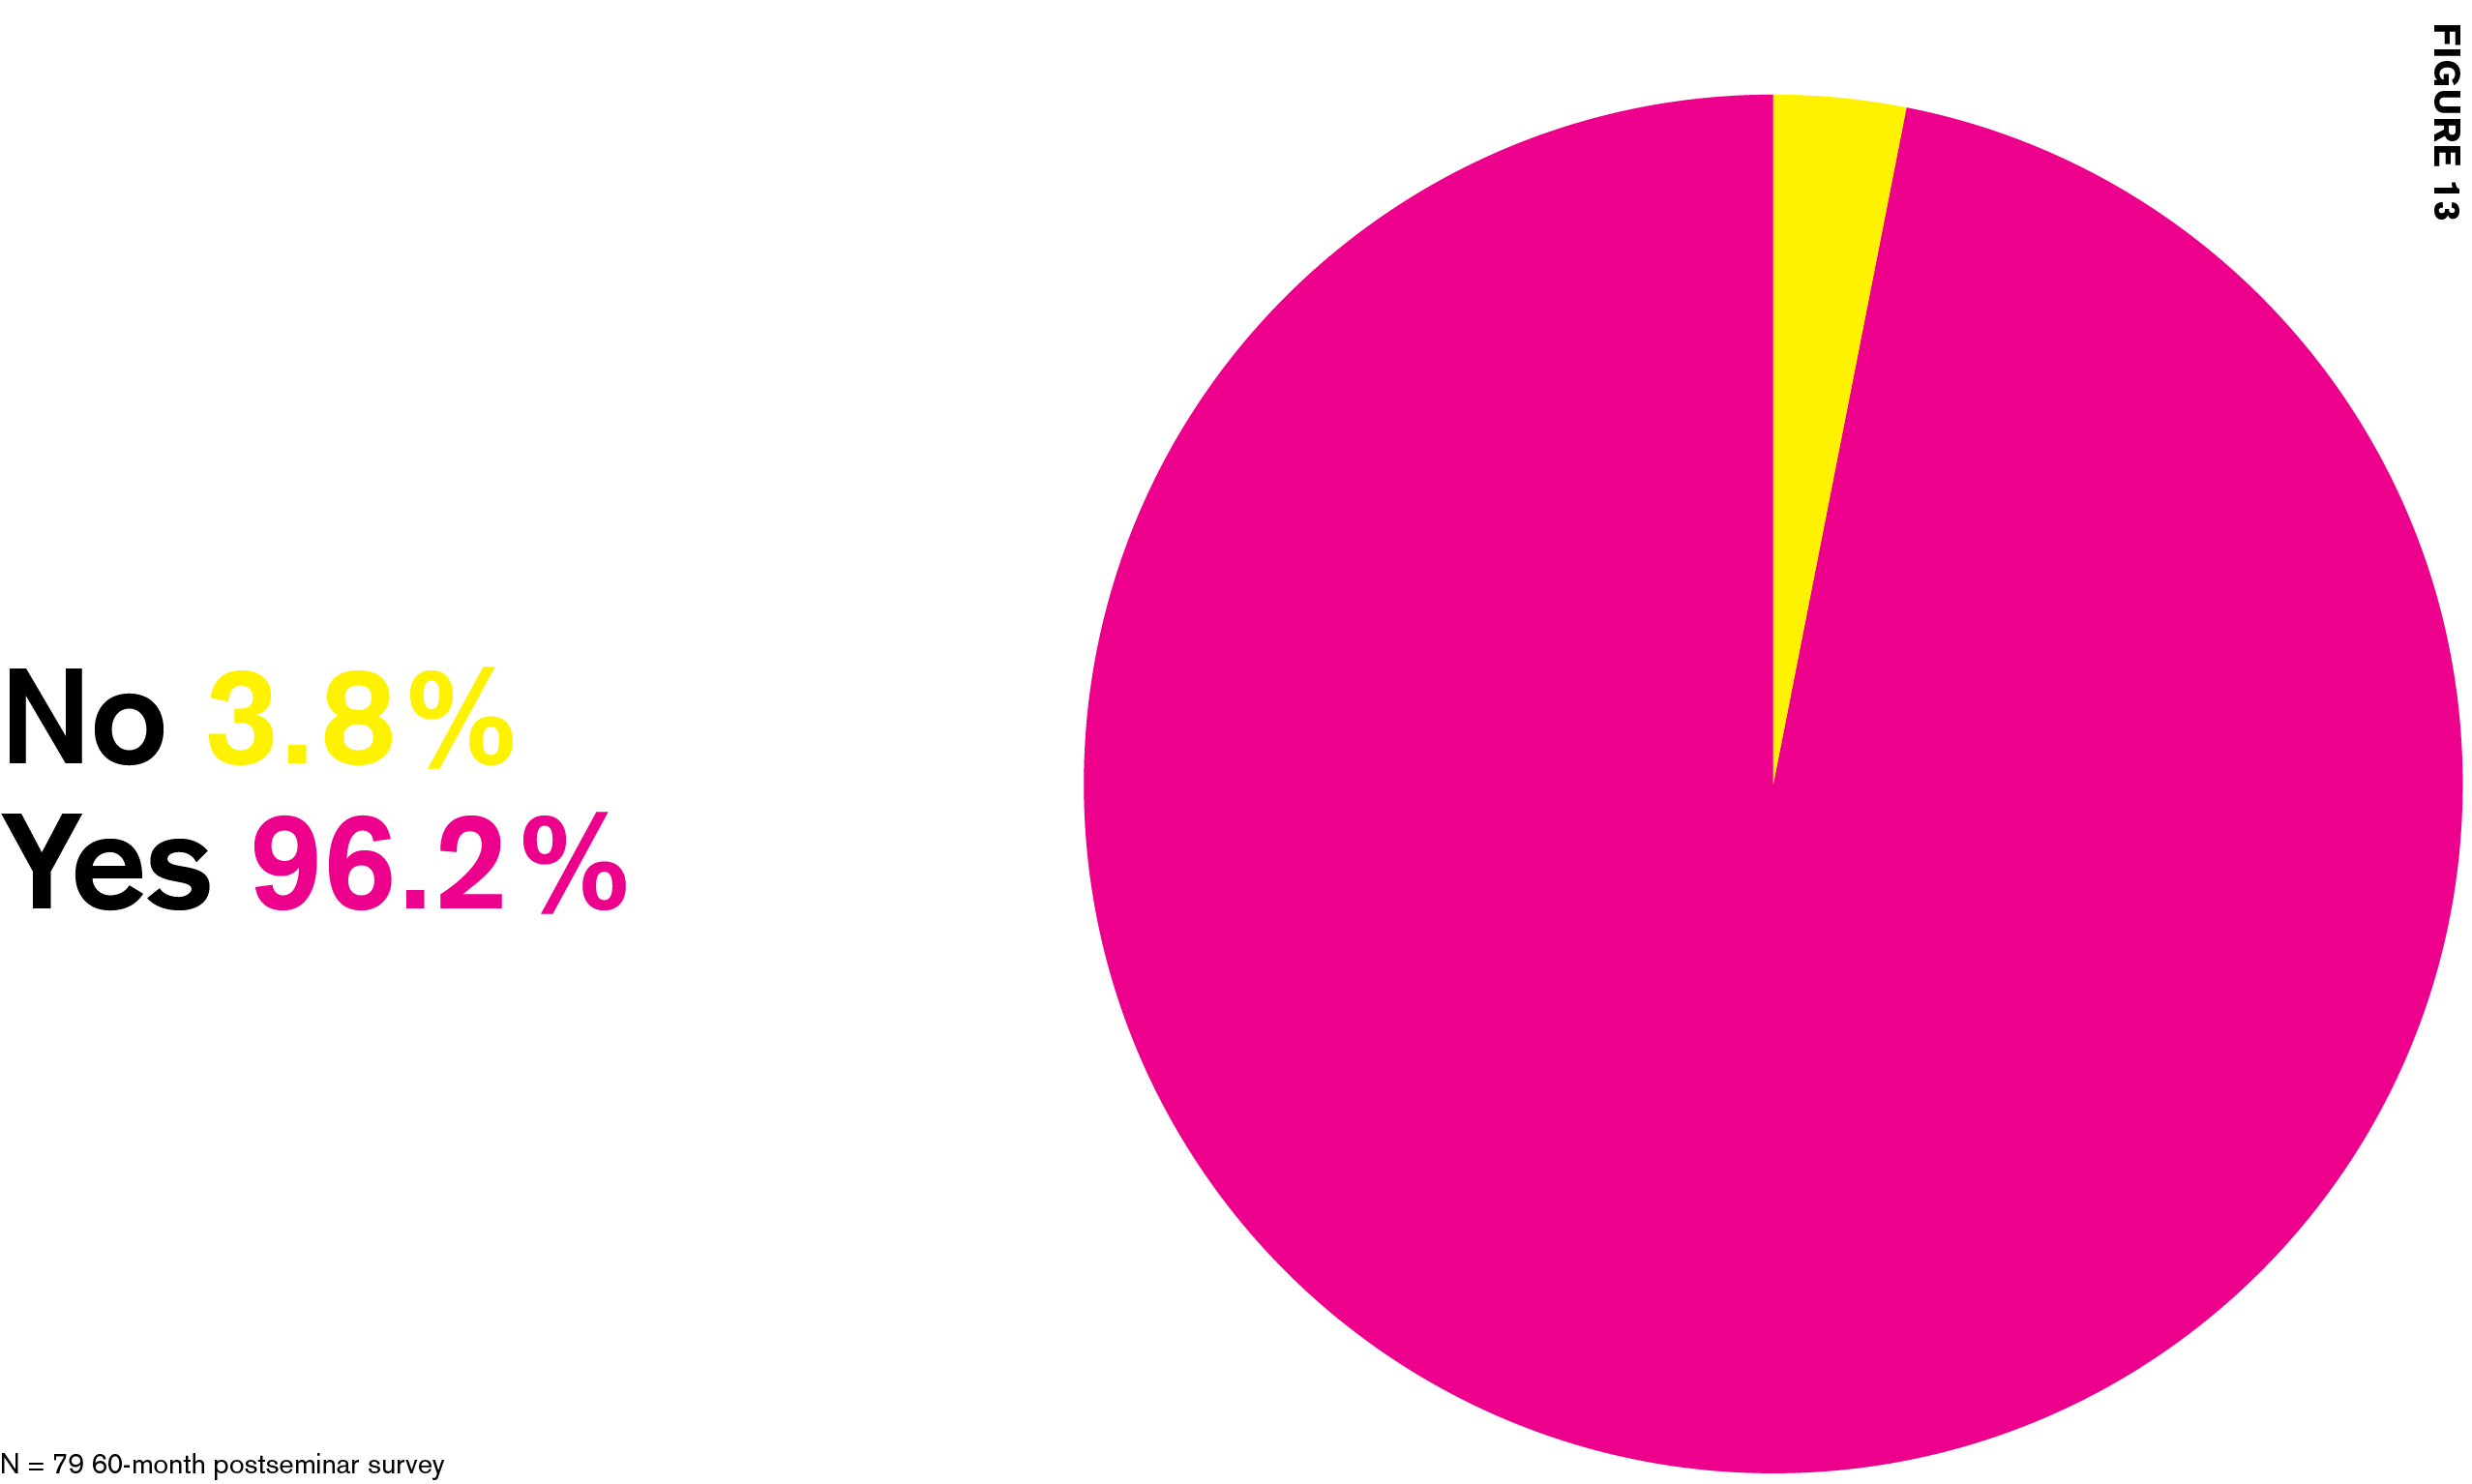
Increase in Shared
Knowledge of Artist INC
96.2% of Artist INC fellows have shared the program information with artists who have not yet participated.
Increase in entrepreneurial
self outlook
This leads to longitudinal changes in the overall community of artists. In 2009 only 26.1% of Artist INC fellows entered the program with written goals. By 2019 60.0% of entering fellows had written goals. In the 2009 session only 56.5% of entering artists considered themselves to be an “entrepreneur.” By 2019 80% of entering artists considered themselves to be “entrepreneurs.”
Longitudinal Changes
in the Artist Community
The ten years’ worth of data on the Kansas City participants in the Artist INC seminar have also highlighted some overall changes that have occurred in the community of artists during this time. While it is inappropriate to presume that these changes are wholly due to the presence of the Artist INC seminar in the community, the “exponentialization” of the program that occurs through artists sharing program information with others would indicate at least some of the community change is related. This rate of sharing is extremely high with 96.2% of participants at sixty months post-seminar indicating that they have shared information they learned in the Artist INC seminar with artists who have not yet participated (Figure 13).
Longitudinal Changes
in the Artist Community
New incoming participants also increasingly indicate their willingness to “seek support/advice/information on their art business from other local artists (of any discipline).” Asked to rate their willingness to seek such support on a scale of one to seven (with one being never and seven being frequently), participants increased their rating on pre-seminar surveys by 32.5% between 2009 and 2019 (Figure 16).
- Intake Spring 2009
-
- Intake Spring 2019
-
- Increase
-
Longitudinal Changes
in the Artist Community
Pre-seminar ratings of the supportiveness of the Kansas City community also increased over time. When asked to rate their agreement with the following statement pre-seminar, “Kansas City is a supportive environment in which to pursue my art,” on a one to seven scale (with one being completely disagree and seven being completely agree), ratings increased by 16.6% between 2009 and 2019 participants (Figure 17).
- Intake Spring 2009
-
- Intake Spring 2019
-
- Increase
-
Longitudinal Changes
in the Artist Community
Increase in
Artist INC ratings
There was an 18% increase in the ratings of incoming Artist INC fellows’ perception of Kansas City as a supportive environment in which to pursue their art between the 2009 and 2019 cohorts.
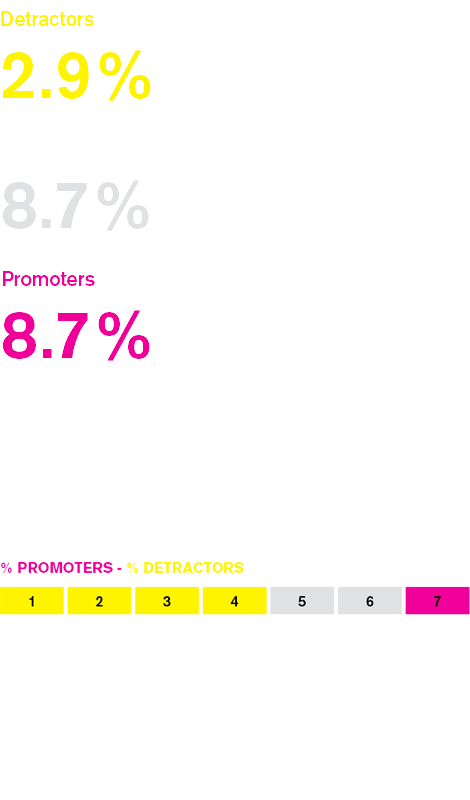
The Program
One of the best measures of the value of the Artist INC program is the willingness of participants to recommend it to prospective artists. A net promoter score (NPS) is a simple way to gauge satisfaction consistently. This widely used score is calculated by surveying people on a simple Likert scale and subtracting the percentage of detractors (low scores) from the percentage of promoters (high scores), leaving one with an NPS between -100 and 100. Based on global NPS standards, any positive score is considered good, as it means there are more promoters than detractors. The Artist INC program consistently garners a “world class” NPS score, with a current compiled NPS of 85.5 (Figure 18).

The most important gap Artist INC fills for artists is learning the power of trusting artists (including themselves).
Challenges + Opportunities
While our anecdotal experience and the data both demonstrate significant positive change across multiple measures in the fellowship of Artist INC participants, there are still challenges for individual artists and the program itself to be addressed.
- Preliminary data indicates that participants’ individual income (including art and non-art sources) ranges from $0 to $125,000 annually
- The overwhelming majority of participants (75% at intake) earn $40,000 or less
- At pre-seminar, 22.5% of participants reported individual earnings of $10,000 or less annually
- By twelve months post-seminar, only 7.5% of the same participants reported individual earnings of less than $10,000, but still the majority make less than $40,000 (67.5%).
- Pre-seminar, 72.1% of participants indicated that less than 20% of their individual income came from their artistic work
- 52.9% of the same participants indicate less than 20% of their individual earnings come from their artistic work sixty months post-seminar.community as a supportive environment in which to pursue their art.

From a financial standpoint, participating artists do show improvements in income, but the average starting place is low and the gains are small. Data on total individual income and debt levels were added to pre-seminar and longitudinal surveys in 2017. Preliminary data indicates that participants’ individual income (including art and non-art sources) ranges from $0 to $125,000 annually, but the overwhelming majority of participants (75% at intake) earn $40,000 or less. Participant individual income does increase twelve months post-seminar, especially in the lowest ranges. At pre-seminar, 22.5% of participants reported individual earnings of $10,000 or less annually. By twelve months post-seminar, only 7.5% of the same participants reported individual earnings of less than $10,000, but still the majority make less than $40,000 (67.5%). Beyond actual income level, the portion of participants’ individual income that is derived from their artistic work is also relatively low. Pre-seminar, 72.1% of participants indicated that less than 20% of their individual income came from their artistic work. While still low, participants do report increasing percentages of their earnings coming from their artistic work, with only 52.9% of the same participants indicating less than 20% of their individual earnings come from their artistic work sixty months post-seminar.
The work of an Artist INC seminar is labor intensive & takes time & organizational resources.
Works Cited
Jackson, M.-R., Kabwasa-Green, F., Swenson, D., Herranz Jr., J., Ferryman, K., Atlas, C., . . . Rosenstein, C. (2003). Urban Institute. Retrieved from urban.org: https://www.urban.org/research/publication/investing-creativity/view/full_report
LINC. (n.d.). LINC. Retrieved 02 13, 2020, from lincnet.net: http://www.lincnet.net/ National Endowment for the Arts. (n.d.). National Endowment for the Arts Appropriations History. Retrieved 2 13, 2020, from arts.gov: https://www.arts.gov/open-government/national-endowment-arts-appropriations-history
In addition to the continuing obstacles facing individual artists, delivering the program itself can be challenging. The work of an Artist INC seminar is labor intensive and takes time and organizational resources. The peer network building and mentorship key to the larger individual philosophical and community changes can’t be accomplished in a limited face-time, one-encounter experience. Simple knowledge delivery can occur in short bursts through a one-off workshop in person or even online. Habits of mind and the building of a trusted community of peers requires multiple contacts and interactions. And these micro-level issues at the individual artist participant level are the same from the macro-level in integrating a new community partner. It can be a difficult addition for artist services organizations, often with already limited human and financial resources, to add to their plates. Facilitating this addition requires multiple contacts and interactions too.
The opposite side of the coin for these challenges is the opportunities provided in the demonstrable long-term changes and “exponentialization” this approach engenders. These changes also occur at both the micro and the macro level. The peer network created in an individual cohort of twenty-five artist participants extends well beyond the original twenty-five artists. Each new Kansas City cohort learns the metaphorical “secret Artist INC handshake” and is connected through a shared experience and philosophy to the fellows before them. In turn, each new extension community added to the Artist INC program is connected as well. The community started in 2009 with twenty-five Kansas City artists is now a community of more than 1,000 artists, in ten communities across six states with each individual artist, and each sponsoring organization taking forward the lessons learned and the ever-increasing network of artists ever building the impact of the original investment in creativity.